
Databricks Notebook Markdown is a special version of the Markdown language built directly into Databricks notebooks. It allows you to add richly formatted text, images, links, and even mathematical equations to your notebooks, turning them from just code scripts into interactive documents and reports.
Think of it as a way to provide context, explanation, and structure to your code cells, making your analysis reproducible and understandable by others (and your future self!).
Why is it Important?
Using Markdown cells effectively transforms your workflow:
- Documentation: Explain the purpose of the analysis, the meaning of a complex transformation, or the interpretation of a result.
- Structure: Create sections, headings, and tables of contents to organize long notebooks.
- Clarity: Add lists, tables, and links to data sources or external references.
- Communication: Share findings with non-technical stakeholders by narrating the story of your data directly alongside the code that generated it.
Key Features and Syntax with Examples
1. Headers (for Structure)
Use # to create different levels of headings.
%md
# Title (H1)
## Section 1 (H2)
### Subsection 1.1 (H3)
#### This is a H4 Header
Title (H1)
Section 1 (H2)
Subsection 1.1 (H3)
This is a H4 Header
2. Emphasis (Bold and Italic)
%md
*This text will be italic*
_This will also be italic_

**This text will be bold**
__This will also be bold__

**_You can combine them_**
This text will be italic This will also be italic
This text will be bold This will also be bold
You can combine them
3. Lists (Ordered and Unordered)
Unordered List:
%md
- Item 1
- Item 2
  - Sub-item 2.1
- Sub-item 2.2- Item 1
- Item 2
- Sub-item 2.1
- Sub-item 2.2
Ordered List:
%md
1. First item
2. Second item
   1. Sub-item 2.1
3. Third item- First item
- Second item
- Sub-item 2.1
- Third item
4. Links and Images
link
%md
[Databricks Website](https://databricks.com)Image
%md
5. Tables
%md
| Column 1 Header | Column 2 Header | Column 3 Header |
|-----------------|-----------------|-----------------|
| Row 1, Col 1    | Row 1, Col 2    | Row 1, Col 3    |
| Row 2, Col 1    | Row 2, Col 2    | Row 2, Col 3    |
| *Italic Cell* | **Bold Cell** | Normal Cell || Column 1 Header | Column 2 Header | Column 3 Header |
|---|---|---|
| Row 1, Col 1 | Row 1, Col 2 | Row 1, Col 3 |
| Row 2, Col 1 | Row 2, Col 2 | Row 2, Col 3 |
| Italic Cell | Bold Cell | Normal Cell |
6. Code Syntax Highlighting (A Powerful Feature)
%md
```python
df = spark.read.table("samples.nyctaxi.trips")
display(df)
```
```sql
SELECT * FROM samples.nyctaxi.trips LIMIT 10;
```
```scala
val df = spark.table("samples.nyctaxi.trips")
display(df)
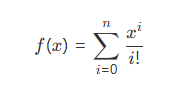
```7. Mathematical Equations (LaTeX)
%md


$$
f(x) = \sum_{i=0}^{n} \frac{x^i}{i!}
$$
Summary
| Feature | Purpose | Example Syntax |
|---|---|---|
| Headers | Create structure and sections | ## My Section |
| Emphasis | Add bold/italic emphasis | **bold**, *italic* |
| Lists | Create bulleted or numbered lists | - Item or 1. Item |
| Tables | Organize data in a grid | | Header | |
| Links/Images | Add references and visuals | [Text](URL) |
| Code Blocks | Display syntax-highlighted code | python\ncode |
| Math (LaTeX) | Render mathematical formulas | $$E = mc^2$$ |
In essence, Databricks Notebook Markdown is the narrative glue that binds your code, data, and insights together, making your notebooks powerful tools for both analysis and communication.