Databricks Notebook Markdown is a special version of the Markdown language built directly into Databricks notebooks. It allows you to add richly formatted text, images, links, and even mathematical equations to your notebooks, turning them from just code scripts into interactive documents and reports.
Think of it as a way to provide context, explanation, and structure to your code cells, making your analysis reproducible and understandable by others (and your future self!).
Why is it Important?
Using Markdown cells effectively transforms your workflow:
Documentation: Explain the purpose of the analysis, the meaning of a complex transformation, or the interpretation of a result.
Structure: Create sections, headings, and tables of contents to organize long notebooks.
Clarity: Add lists, tables, and links to data sources or external references.
Communication: Share findings with non-technical stakeholders by narrating the story of your data directly alongside the code that generated it.
Key Features and Syntax with Examples
1. Headers (for Structure)
Use # to create different levels of headings.
%md
# Title (H1)
## Section 1 (H2)
### Subsection 1.1 (H3)
#### This is a H4 Header
Title (H1)
Section 1 (H2)
Subsection 1.1 (H3)
This is a H4 Header
2. Emphasis (Bold and Italic)
%md
*This text will be italic*
_This will also be italic_

**This text will be bold**
__This will also be bold__

**_You can combine them_**
In essence, Databricks Notebook Markdown is the narrative glue that binds your code, data, and insights together, making your notebooks powerful tools for both analysis and communication.
Today, data engineers have a wide array of tools and platforms at their disposal for data engineering projects. Popular choices include Microsoft Fabric, Azure Synapse Analytics (ASA), Azure Data Factory (ADF), and Azure Databricks (ADB). It’s common to wonder which one is the best fit for your specific needs.
Side by Side comparison
Here’s a concise comparison of Microsoft Fabric, Azure Synapse Analytics, Azure Data Factory (ADF), and Azure Databricks (ADB) based on their key features, use cases, and differences:
Limited (relies on Delta Lake, ADF, or custom code)
Data Warehousing
OneLake (Delta-Parquet based)
Dedicated SQL pools (MPP)
Not applicable
Can integrate with Synapse/Delta Lake
Big Data Processing
Spark-based (Fabric Spark)
Spark pools (serverless/dedicated)
No (orchestration only)
Optimized Spark clusters (Delta Lake)
Real-Time Analytics
Yes (Real-Time Hub)
Yes (Synapse Real-Time Analytics)
No
Yes (Structured Streaming)
Business Intelligence
Power BI (deeply integrated)
Power BI integration
No
Limited (via dashboards or Power BI)
Machine Learning
Basic ML integration
ML in Spark pools
No
Full ML/DL support (MLflow, AutoML)
Pricing Model
Capacity-based (Fabric SKUs)
Pay-as-you-go (serverless) or dedicated
Activity-based
DBU-based (compute + storage)
Open Source Support
Limited (Delta-Parquet)
Limited (Spark, SQL)
No
Full (Spark, Python, R, ML frameworks)
Governance
Centralized (OneLake, Purview)
Workspace-level
Limited
Workspace-level (Unity Catalog)
Key Differences
Fabric vs Synapse: Fabric is a fully managed SaaS (simpler, less configurable), while Synapse offers more control (dedicated SQL pools, Spark clusters).
Data quality is more critical than ever in today’s data-driven world. Organizations are generating and collecting vast amounts of data, and the ability to trust and leverage this information is paramount for success. Poor data quality can have severe negative impacts, ranging from flawed decision-making to regulatory non-compliance and significant financial losses.
Key Dimensions of Data Quality (DAMA-DMBOK or ISO 8000 Standards)
A robust DQX evaluates data across multiple dimensions:
Accuracy: Data correctly represents real-world values.
Completeness: No missing or null values where expected.
Consistency: Data is uniform across systems and over time.
Timeliness: Data is up-to-date and available when needed.
Validity: Data conforms to defined business rules (e.g., format, range).
Uniqueness: No unintended duplicates.
Integrity: Relationships between datasets are maintained.
What is Data Quality Framework (DQX)
A Data Quality Framework (DQX) is an open-source framework from Databricks Labs designed to simplify and automate data quality checks for PySpark workloads on both batch and streaming data.
DAX is a structured approach to assessing, monitoring, and improving the quality of data within an organization. It define, validate, and enforce data quality rules across your data pipelines. It ensures that data is accurate, consistent, complete, reliable, and fit for its intended use. so it can be used confidently for analytics, reporting, compliance, and decision-making.
This article will explore how the DQX framework helps improve data reliability, reduce data errors, and enforce compliance with data quality standards. We will step by step go through all steps, from setup and use DQX framework in databricks notebook with code snippets to implement data quality checks.
DQX usage in the Lakehouse Architecture
In the Lakehouse architecture, new data validation should happen during data entry into the curated layer to ensure bad data is not propagated to the subsequent layers. With DQX, you can implement Dead-Letter pattern to quarantine invalid data and re-ingest it after curation to ensure data quality constraints are met. The data quality can be monitored in real-time between layers, and the quarantine process can be automated.
Benchmarking: Compare against industry standards or past performance.
B. Data Quality Rules & Standards
Define validation rules (e.g., “Email must follow RFC 5322 format”).
Implement checks at the point of entry (e.g., form validation) and during processing.
C. Governance & Roles
Assign data stewards responsible for quality.
Establish accountability (e.g., who fixes issues? Who approves changes?).
D. Monitoring & Improvement
Automated checks: Use tools like Great Expectations, Talend, or custom scripts.
Root Cause Analysis (RCA): Identify why errors occur (e.g., system glitches, human input).
Continuous Improvement: Iterative fixes (e.g., process changes, user training).
E. Tools & Technology
Data Quality Tools: Informatica DQ, IBM InfoSphere, Ataccama, or open-source (Apache Griffin).
Metadata Management: Track data lineage and quality scores.
AI/ML: Anomaly detection (e.g., identifying drift in datasets).
F. Culture & Training
Promote data literacy across teams.
Encourage reporting of data issues without blame.
Using Databricks DQX Framework in a Notebook
Step by Step Implementing DQX
Step 1: Install the DQX Library
install it using the Databricks Labs CLI:
%pip install databricks-labs-dqx

# Restart the kernel after the package is installed in the notebook:
# in a separate cell run:
dbutils.library.restartPython()
Step 2: Initialize the Environment and read input data
Set up the necessary environment for running the Databricks DQX framework, including:
Importing the key components from the Databricks DQX library.
DQProfiler: Used for profiling the input data to understand its structure and generate summary statistics.
DQGenerator: Generates data quality rules based on the profiles.
DQEngine: Executes the defined data quality checks.
WorkspaceClient: Handles communication with the Databricks workspace.
Import Libraries
from databricks.labs.dqx.profiler.profiler import DQProfiler
from databricks.labs.dqx.profiler.generator import DQGenerator
from databricks.labs.dqx.engine import DQEngine
from databricks.sdk import WorkspaceClient
Loading the input data that you want to evaluate.
# Read the input data from a Delta table
input_df = spark.read.table("catalog.schema.table")
Establishing a connection to the Databricks workspace.
# Initialize the WorkspaceClient to interact with the Databricks workspace
ws = WorkspaceClient()

# Initialize a DQProfiler instance with the workspace client
profiler = DQProfiler(ws)
Profiling for data quality.
# Profile the input DataFrame to get summary statistics and data profiles

summary_stats, profiles = profiler.profile(input_df)
The profiler samples 30% of the data (sample ratio = 0.3) and limits the input to 1000 records by default.
Profiling a Table
Tables can be loaded and profiled using profile_table.
from databricks.labs.dqx.profiler.profiler import DQProfiler
from databricks.sdk import WorkspaceClient

# Profile a single table directly
ws = WorkspaceClient()
profiler = DQProfiler(ws)

# Profile a specific table with custom options
summary_stats, profiles = profiler.profile_table(
    table="catalog1.schema1.table1",
    columns=["col1", "col2", "col3"],  # specify columns to profile
    options={
        "sample_fraction": 0.1,  # sample 10% of data
        "limit": 500,            # limit to 500 records
        "remove_outliers": True, # enable outlier detection
        "num_sigmas": 2.5       # use 2.5 standard deviations for outliers
    }
)

print("Summary Statistics:", summary_stats)
print("Generated Profiles:", profiles)
Profiling Multiple Tables
The profiler can discover and profile multiple tables in Unity Catalog. Tables can be passed explicitly as a list or be included/excluded using regex patterns.
from databricks.labs.dqx.profiler.profiler import DQProfiler
from databricks.sdk import WorkspaceClient

ws = WorkspaceClient()
profiler = DQProfiler(ws)

# Profile several tables by name:
results = profiler.profile_tables(
    tables=["main.data.table_001", "main.data.table_002"]
)

# Process results for each table
for summary_stats, profiles in results:
    print(f"Table statistics: {summary_stats}")
    print(f"Generated profiles: {profiles}")

# Include tables matching specific patterns
results = profiler.profile_tables(
    patterns=["$main.*", "$data.*"]
)

# Process results for each table
for summary_stats, profiles in results:
    print(f"Table statistics: {summary_stats}")
    print(f"Generated profiles: {profiles}")

# Exclude tables matching specific patterns
results = profiler.profile_tables(
    patterns=["$sys.*", ".*_tmp"],
    exclude_matched=True
)

# Process results for each table
for summary_stats, profiles in results:
    print(f"Table statistics: {summary_stats}")
    print(f"Generated profiles: {profiles}")
Profiling Options
The profiler supports extensive configuration options to customize the profiling behavior.
from databricks.labs.dqx.profiler.profiler import DQProfiler
from databricks.sdk import WorkspaceClient

# Custom profiling options
custom_options = {
# Sampling options
"sample_fraction": 0.2, # Sample 20% of the data
"sample_seed": 42, # Seed for reproducible sampling
"limit": 2000, # Limit to 2000 records after sampling

# Outlier detection options
"remove_outliers": True, # Enable outlier detection for min/max rules
"outlier_columns": ["price", "age"], # Only detect outliers in specific columns
"num_sigmas": 2.5, # Use 2.5 standard deviations for outlier detection

# Null value handling
"max_null_ratio": 0.05, # Generate is_not_null rule if <5% nulls

# String handling
"trim_strings": True, # Trim whitespace from strings before analysis
"max_empty_ratio": 0.02, # Generate is_not_null_or_empty if <2% empty strings

# Distinct value analysis
"distinct_ratio": 0.01, # Generate is_in rule if <1% distinct values
"max_in_count": 20, # Maximum items in is_in rule list

# Value rounding
"round": True, # Round min/max values for cleaner rules
}

ws = WorkspaceClient()
profiler = DQProfiler(ws)

# Apply custom options to profiling
summary_stats, profiles = profiler.profile(input_df, options=custom_options)

# Apply custom options when profiling tables
tables = [
"dqx.demo.test_table_001",
"dqx.demo.test_table_002",
"dqx.demo.test_table_003", # profiled with default options
]
table_options = {
"dqx.demo.test_table_001": {"limit": 2000},
"dqx.demo.test_table_002": {"limit": 5000},
}
summary_stats, profiles = profiler.profile_tables(tables=tables, options=table_options)
Understanding output
Assuming the sample data is:
customer_id
customer_name
customer_email
is_active
start_date
end_date
1
Alice
alice@mainri.ca
1
2025-01-24
null
2
Bob
bob_new@mainri.ca
1
2025-01-24
null
3
Charlie
invalid_email
1
2025-01-24
null
3
Charlie
invalid_email
0
2025-01-24
2025-01-24
# Initialize the WorkspaceClient to interact with the Databricks workspace
ws = WorkspaceClient()

# Initialize a DQProfiler instance with the workspace client
profiler = DQProfiler(ws)

# Read the input data from a Delta table
input_df = spark.read.table("catalog.schema.table")

# Display a sample of the input data
input_df.display()

# Profile the input DataFrame to get summary statistics and data profiles
summary_stats, profiles = profiler.profile(input_df)
Upon checking the summary and profile of my input data generated, below are the results generated by DQX
print(summary_stats)
Summary of input data on all the columns in input dataframe
In addition to the automatically generated checks, you can define your own custom rules to enforce business-specific data quality requirements. This is particularly useful when your organization has unique validation criteria that aren’t covered by the default checks. By using a configuration-driven approach (e.g., YAML), you can easily maintain and update these rules without modifying your pipeline code.
For example, you might want to enforce that:
Customer IDs must not be null or empty.
Email addresses must match a specific domain format (e.x: @example.com).
# Validate the custom data quality checks
status = DQEngine.validate_checks(checks_custom)

# The above variable for the custom config yaml file can also be pased from workspace file path as given below:
status = DQEngine.validate_checks("path to yaml file in workspace")

# Assert that there are no errors in the validation status
assert not status.has_errors
Step 5: Applying the custom rules and generating results
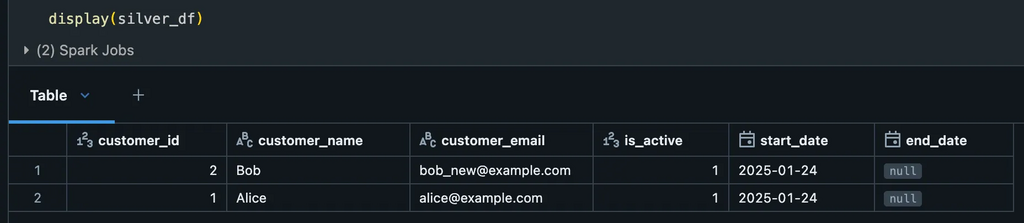
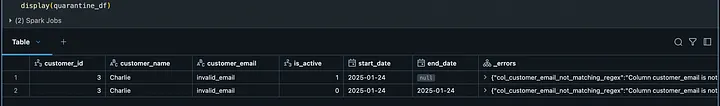
Once your custom data quality rules have been defined and validated, the next step is to apply them to your input data. The DQEngine facilitates this by splitting your dataset into two categories:
Silver Data: Records that meet all quality expectations.
Quarantined Data: Records that fail one or more quality checks.
This approach allows you to separate valid and invalid data for further inspection and remediation. The valid records can proceed to downstream processes, while the quarantined records can be analyzed to determine the cause of failure (e.g., missing values, incorrect formats).
Here’s how you can apply the rules and generate the results:
# Create a DQEngine instance with the WorkspaceClient
dq_engine = DQEngine(WorkspaceClient())

# Apply quality checks and split the DataFrame into silver and quarantine DataFrames
silver_df, quarantine_df = dq_engine.apply_checks_by_metadata_and_split(input_df_1, checks_custom)
Silver data (Valid)Quarantined data – Not matching the rules
Summary
In essence, data quality is no longer just an IT concern; it’s a fundamental business imperative. In today’s complex and competitive landscape, the success of an organization hinges on its ability to leverage high-quality, trusted data for every strategic and operational decision.
A Data Quality Framework (DQX) helps organizations:
This article will discuss a new approach for Azure Data Factory (ADF) or Synapse Analytics (ASA) to leverage the Microsoft Graph API for accessing and integrating with various Microsoft 365 services and data. Examples include ADF downloading files from SharePoint (SPO) to Azure Data Lake Storage (ADLS), creating folders in SharePoint libraries, and moving files between SharePoint folders.
I recently received reports indicating that our previous method for downloading files from their SharePoint Online (SPO) environment is no longer working. Upon investigation, I confirmed that changes to the configuration of some SharePoint sites prevent the standard download solution from functioning.
What is Microsoft Graph API.
The Microsoft Graph API is a unified RESTful web API provided by Microsoft that allows developers to access and integrate with a wide range of Microsoft 365 services and data. This includes data from:
Azure Active Directory (Entra ID)
Outlook (Mail, Calendar, Contacts)
OneDrive and SharePoint
Teams
Excel
Planner
Intune
To Do, and many others.
Scenario
At Mainri Corporation, colleagues upload files to a designated folder on their SharePoint site. As part of their data centralization process, files from a shared SharePoint Online folder named “Current” are copied to ADLS. Once the copy is successful, these files are then relocated from the “Current” folder to an “Archive” folder within the same SPO Library.
For this purpose, let’s utilize the mainri SharePoint Online (SPO) site, ‘IT-BA-site’ (also known as ‘IT Business Partners’), along with its dummy library and folders. The library’s name is ‘Finance’.
There are multiple folders under the Finance Library, colleagues upload file to: Finance/Business Requests/AR Aging Report/Current. The Archive folder is: Finance/Business Requests/AR Aging Report/Archive .
Prerequisites:
An Azure AD Application (AAD) Registration with Microsoft Graph API permissions.
Because SharePoint is a protected Microsoft 365 service, ADF cannot access it directly. So you:
Register an AAD App
Assign it permission to read SharePoint files (Sites.Read.All, Files.Read.All)
Use the AAD App credentials (client ID, secret, tenant ID) to obtain an access token
Pass that token to Microsoft Graph API from ADF pipelines (using Web Activity + HTTP Binary Dataset)
Register an Azure Active Directory Application (AAD App) in Azure
Go to Azure Portal > Azure Active Directory > App registrations.
Click “New registration”.
Name: ADF-GraphAPI-App
Supported account types: Single tenant.
Click Register.
we want to get:
Client ID: Unique ID of your app — used in all API calls
Tenant ID: Your Azure AD directory ID
Client Secret: Password-like value — proves app identity
Permissions: Defines what APIs the app is allowed to access
Grant Graph API Permissions
Go to the API permissions tab.
Click “Add a permission” > Microsoft Graph > Application permissions.
Add these (at minimum):
Sites.Read.All – to read SharePoint site content.
Files.Read.All – to read files in document libraries.
Click “Grant admin consent” to enable these permissions.
Solution
The ADF major steps and activities are:
Register an Azure AD Application (if not using Managed Identity), Grant the application the necessary Microsoft Graph API permissions, specifically Sites.Selected.
Enable Managed Identity for your ADF (Recommended), Grant the ADF’s managed identity the necessary Microsoft Graph API permissions, specifically Sites.Selected. Enable Managed Identity for your ADF (Recommended), Grant the ADF’s managed identity the necessary Microsoft Graph API permissions, specifically Sites.Selected.
Create a HTTP Linked Service in ADF,
Base URL:
https://graph.microsoft.com/v1.0
Web Activity to get an access token
URL: https://login.microsoftonline.com/<your_tenant_id>/oauth2/tokenMethod: POST
Body: (for Service Principal authentication)
JSON
{
"grant_type": "client_credentials",
"client_id": "<your_application_id>",
"client_secret": "<your_client_secret>",
"resource": "https://graph.microsoft.com"
}
Authentication: None Headers:Content-Type: application/x-www-form-urlencoded
Web Activity to get the Site ID
URL:https://graph.microsoft.com/v1.0/sites/<your_sharepoint_domain>:/sites/<your_site_relative_path>(e.g., https://mainri.sharepoint.com:/sites/finance)

Method: GET

Authentication: none

header: "Authorization"
@concat('Bearer ', activity('<your_get_token_activity_name>').output.access_token).
Web Activity to list the drives (document libraries)
Web Activity (or ForEach Activity with a nested Web Activity) to list the items (files and folders) in a specific drive/folder:
URL: @concat('https://graph.microsoft.com/v1.0/drives/', '<your_drive_id>', '/items/<your_folder_id>/children') (You might need to iterate through folders recursively if you have nested structures).

Method: GET

Authentication: none

header: "Authorization"
@concat('Bearer ', activity('<your_get_token_activity_name>').output.access_token).
Copy Activity to download the file content
Source: HTTP Binary
Relative URL:@item()['@microsoft.graph.downloadUrl']method: GET
Sink: Configure a sink to your desired destination (e.g., Azure Blob Storage, Azure Data Lake Storage). Choose a suitable format (Binary for files as-is).
Finally, Web Activity move processed file to Archive area.
expires_in: This tells you how many seconds the access token is valid for — in your case, 3599 seconds (which is just under 1 hour). After this time, the token will expire and cannot be used to call the Graph API anymore.
ext_expires_in: This is the extended expiry time. It represents how long the token can still be accepted by some Microsoft services (under specific circumstances) after it technically expires. This allows some apps to use the token slightly longer depending on how token caching and refresh policies are handled.
For production apps, you should always implement token refresh using the refresh token before expires_in hits zero.
Save the token in a variable, as we will use it in subsequent activities.
Set variable activity Purpose: for following activities conveniences, save it in a variable.
@activity('GetBearerToken').output.access_token
Step 3: Get SPO site ID via Graph API by use Bearer Token
Sometime your SharePoint / MS 365 administrator may give you SiteID. If you do not have it, you can do this way to get it.
Web activity purpose: We will first obtain the “site ID,” a key value used for all subsequent API calls.
from the output, we can see that ID has 3 partitions. the entire 3-part string is the site ID. It is a composite of:
hostname (e.g., mainri.sharepoint.com)
site collection ID (a GUID)
site ID (another GUID)
Step 4: Get SPO Full Drivers list via Graph API by use Bearer Token
“Driver” also known as Library.
Web activity purpose: Since there are multiple Drivers/Libraries in the SPO, now we list out all Drivers/Libraries; find out the one that we are interested in – Finance.
Web Activity Purpose: We require the folder IDs for the “Current” folder (where colleagues upload files) and the “Archive” folder (for saving processed data), as indicated by the business, to continue. — “Current” for colleagues uploading files to here — “Archive” for saving processed files
If condition Activity Purpose: To check if a folder for today’s date (2025-05-10) already exists and determine if a new folder needs to be created for today’s archiving.
Within the IF-Condition activity “True” activity, there more actions we take.
Since new files are in ‘Current’, we will now COPY and ARCHIVE them.
Find out “Archive” folder, then get the Archive folder ID
List out all child items under “Archive” folder
Run ‘pl_child_L1_chk_rundate_today_exists’ to see if ‘rundate=2025-05-12’ exists. If so, skip creation; if not, create ‘rundate=2025-05-12’ under ‘Archive’..
Get all items in ‘Archive’ and identify the ID of the ‘rundate=2025-05-13’ folder.
Then, run ‘pl_child_L1_copy_archive’ to transfer SPO data to ADLS and archive ‘current’ to ‘Archive/rundate=2025-05-12’.
Begin implementing the actions outlined above.
We begin the process by checking the ‘Current’ folder to identify any files for copying. It’s important to note that this folder might not contain any files at this time.
Step 14: Inside the ‘chk-has-files’ IF-Condition activity, find the ID of ‘Archive’ using a filter.
Filter activity Purpose: Find “Archive” ID
Items: @activity('Get AR Aging Children').output.value
Condition: @equals(item().name, 'Archive')
Output segments
Step 15: Get Archive’s child items list
Web Activity Purposes: Check the sub-folders in ‘Archive’ for ‘rundate=2025-05-13‘ to determine if creation is needed.
Above steps, we have successfully find out all we need:
SiteID
Driver/Library ID
sub-folder(s) ID
We will now create a sub-folder under “archive” with the following naming pattern: rundate=2024-09-28
“Archive” folder looks: ../Archive/rundate=2024-09-28 ….. ../Archive/rundate=2024-11-30 …. etc.
Processed files are archived in sub-folders named by their processing date. ../Archive/rundate=2024-09-28/file1.csv ../Archive/rundate=2024-09-28/file2.xlsx … etc.
The Microsoft Graph API will return an error if we attempt to create a folder that already exists. Therefore, we must first verify the folder’s existence before attempting to create it.
As part of today’s data ingestion from SPO to ADLS (May 13, 2025), we need to determine if an archive sub-folder for today’s date already exists. We achieve this by listing the contents of the ‘Archive’ folder and checking for a sub-folder named ‘rundate=2025-05-13‘. If this sub-folder is found, we proceed with the next steps. If it’s not found, we will create a new sub-folder named ‘rundate=2025-05-13‘ within the ‘Archive’ location.
Step 16: Identify the folder named ‘rundate=<<Today Date>>’
Filter activity Purpose: Verifying the existence of ‘rundate=2025-05-10‘ to determine if today’s archive folder needs creation.
Within the IF-Condition activity, if the check for today’s folder returns false (meaning it doesn’t exist), we will proceed to create a new folder named ‘rundate=2025-05-10‘.
After creating the new folder, we will extract its ID. This ID will then be stored in a variable for use during the “Archiving” process.
Step 20: Get “Archive” folder child Items Again
As the ‘rundate=2024-05-12‘ folder could have been created either in the current pipeline run (during a previous step) or in an earlier execution today, we are re-retrieving the child items of the ‘Archive’ folder to ensure we have the most up-to-date ID.
Execute Activity Purpose: Implement the process to copy files from SPO to ADLS and archive processed files from the “Current” folder in SPO to the “Archive” folder in SPO.
ForEach activity Purpose: Iterate through each item in the file list.
Items: @pipeline().parameters.child_para_item
The ForEach loop will iterate through each file, performing the following actions: copying the file to Azure Data Lake Storage and subsequently moving the processed file to the ‘Archive’ folder.
Step 23: Copy file to ADLS
Copy activity purpose: copy file to ADLS one by one
The pipeline includes checks for folder existence to avoid redundant creation, especially in scenarios where the pipeline might be re-run. The IDs of relevant folders (“Archive” and the date-specific sub-folders) are retrieved dynamically throughout the process using filtering and list operations.
In essence, this pipeline automates the process of taking newly uploaded files, transferring them to ADLS, and organizing them within an archive structure based on the date of processing.
Register an Azure AD Application (if not using Managed Identity), Grant the application the necessary Microsoft Graph API permissions, specifically Sites.Selected.
Enable Managed Identity for your ADF (Recommended), Grant the ADF’s managed identity the necessary Microsoft Graph API permissions, specifically Sites.Selected. Enable Managed Identity for your ADF (Recommended), Grant the ADF’s managed identity the necessary Microsoft Graph API permissions, specifically Sites.Selected.
Create a HTTP Linked Service in ADF, Base URL: https://graph.microsoft.com/v1.0
Web Activity to get an access token URL:https://login.microsoftonline.com/<your_tenant_id>/oauth2/tokenMethod: POST Body: (for Service Principal authentication) JSON { “grant_type”: “client_credentials”, “client_id”: “<your_application_id>”, “client_secret”: “<your_client_secret>”, “resource”: “https://graph.microsoft.com” } Authentication: None Headers: Content-Type: application/x-www-form-urlencoded
get the Site ID Web Activity to get the Site ID URL:https://graph.microsoft.com/v1.0/sites/<your_sharepoint_domain>:/sites/<your_site_relative_path> (e.g., https://mainri.sharepoint.com:/sites/finance) Method: GET Authentication: none header: “Authorization” @concat('Bearer ', activity('<your_get_token_activity_name>').output.access_token).
Web Activity to list the drives (document libraries) URL:@concat('https://graph.microsoft.com/v1.0/sites/', activity('<your_get_site_id_activity_name>').output.id, '/drives') Method: GET Authentication: none header: “Authorization” @concat('Bearer ', activity('<your_get_token_activity_name>').output.access_token).
Web Activity (or ForEach Activity with a nested Web Activity) to list the items (files and folders) in a specific drive/folder: URL:@concat('https://graph.microsoft.com/v1.0/drives/', '<your_drive_id>', '/items/<your_folder_id>/children') (You might need to iterate through folders recursively if you have nested structures). Method: GET Authentication: none header: “Authorization” @concat('Bearer ', activity('<your_get_token_activity_name>').output.access_token).
Copy Activity to download the file content Source: HTTP Binary Relative URL:@item()['@microsoft.graph.downloadUrl'] method: GET Sink: Configure a sink to your desired destination (e.g., Azure Blob Storage, Azure Data Lake Storage). Choose a suitable format (Binary for files as-is).
In Azure Databricks Unity Catalog, you can create different types of tables depending on your storage and management needs. The main table types are including Managed Tables, External Tables, Delta Tables, Foreign Tables, Streaming Tables, Live Tables (deprecated), Feature Tables, and Hive Tables (legacy). Each table type is explained in detail, and a side-by-side comparison is provided for clarity.
Side-by-Side Comparison Table
Feature
Managed Tables
External Tables
Delta Tables
Foreign Tables
Streaming Tables
Delta Live Tables (DLT)
Feature Tables
Hive Tables (Legacy)
Storage
Databricks-managed
External storage
Managed/External
External database
Databricks-managed
Databricks-managed
Managed/External
Managed/External
Location
Internal Delta Lake
Specified external path
Internal/External Delta Lake
External metastore (Snowflake, BigQuery)
Internal Delta Lake
Internal Delta Lake
Internal/External Delta Lake
Internal/External storage
Ownership
Databricks
User
Databricks/User
External provider
Databricks
Databricks
Databricks/User
Databricks (Legacy Hive Metastore)
Deletion Impact
Deletes data & metadata
Deletes only metadata
Depends (Managed: Deletes, External: Keeps data)
Deletes only metadata reference
Deletes data & metadata
Deletes data & metadata
Deletes metadata (but not feature versions)
Similar to Managed/External
Format
Delta Lake
Parquet, CSV, JSON, Delta
Delta Lake
Snowflake, BigQuery, Redshift, etc.
Delta Lake
Delta Lake
Delta Lake
Parquet, ORC, Avro, CSV
Use Case
Full lifecycle management
Sharing with external tools
Advanced data versioning & ACID compliance
Querying external DBs
Continuous data updates
ETL Pipelines
ML feature storage
Legacy storage (pre-Unity Catalog)
Table type and describes
1. Managed Tables
Managed tables are tables where both the metadata and the data are managed by Unity Catalog. When you create a managed table, the data is stored in the default storage location associated with the catalog or schema.
Data Storage and location:
Unity Catalog manages both the metadata and the underlying data in a Databricks-managed location
The data is stored in a Unity Catalog-managed storage location. Typically in an internal Delta Lake storage, e.g., DBFS or Azure Data Lake Storage
Use Case:
Ideal for Databricks-centric workflows where you want Databricks to handle storage and metadata.
Pros & Cons:
Pros: Easy to manage, no need to worry about storage locations.
Cons: Data is tied to Databricks, making it harder to share externally.
Example:
CREATE TABLE managed_table (
    id INT,
    name STRING
);

INSERT INTO managed_table VALUES (1, 'Alice');

SELECT * FROM managed_table;
2. External Tables
External tables store metadata in Unity Catalog but keep data in an external storage location (e.g., Azure Blob Storage, ADLS, S3).
Data storage and Location:
The metadata is managed by Unity Catalog, but the actual data remains in external storage (like Azure Data Lake Storage Gen2 or an S3 bucket).
You must specify an explicit storage location, e.g., Azure Blob Storage, ADLS, S3).
Use Case:
Ideal for cross-platform data sharing or when data is managed outside Databricks.
Pros and Cons
Pros: Data is decoupled from Databricks, making it easier to share.
Cons: Requires manual management of external storage and permissions.
Preparing create external table
Before you can create an external table, you must create a storage credential that allows Unity Catalog to read from and write to the path on your cloud tenant, and an external location that references it.
Requirements
In Azure, create a service principal and grant it the Azure Blob Contributor role on your storage container.
In Azure, create a client secret for your service principal. Make a note of the client secret, the directory ID, and the application ID for the client secret.
step 1: Create a storage credential
You can create a storage credential using the Catalog Explorer or the Unity Catalog CLI. Follow these steps to create a storage credential using Catalog Explorer.
In a new browser tab, log in to Databricks.
Click Catalog.
Click Storage Credentials.
Click Create Credential.
Enter example_credential for he name of the storage credential.
Set Client Secret, Directory ID, and Application ID to the values for your service principal.
Optionally enter a comment for the storage credential.
Click Save. Leave this browser open for the next steps.
Create an external location
An external location references a storage credential and also contains a storage path on your cloud tenant. The external location allows reading from and writing to only that path and its child directories. You can create an external location from Catalog Explorer, a SQL command, or the Unity Catalog CLI. Follow these steps to create an external location using Catalog Explorer.
Go to the browser tab where you just created a storage credential.
Click Catalog.
Click External Locations.
Click Create location.
Enter example_location for the name of the external location.
Enter the storage container path for the location allows reading from or writing to.
Set Storage Credential to example_credential to the storage credential you just created.
Optionally enter a comment for the external location.
Click Save.
-- Grant access to create tables in the external location
GRANT USE CATALOG
ON example_catalog
TO `all users`;

GRANT USE SCHEMA
ON example_catalog.example_schema
TO `all users`;

GRANT CREATE EXTERNAL TABLE
ON LOCATION example_location
TO `all users`;
-- Create an example catalog and schema to contain the new table
CREATE CATALOG IF NOT EXISTS example_catalog;
USE CATALOG example_catalog;
CREATE SCHEMA IF NOT EXISTS example_schema;
USE example_schema;
-- Create a new external Unity Catalog table from an existing table
-- Replace <bucket_path> with the storage location where the table will be created
CREATE TABLE IF NOT EXISTS trips_external
LOCATION 'abfss://<bucket_path>'
AS SELECT * from samples.nyctaxi.trips;

-- To use a storage credential directly, add 'WITH (CREDENTIAL <credential_name>)' to the SQL statement.
There are some useful Microsoft document to be refer:
Delta tables use the Delta Lake format, providing ACID transactions, scalable metadata handling, and data versioning.
Data Storage and Location
A special type of managed or external table that uses Delta Lake format.
Can be in managed storage or external storage.
Use Case:
Ideal for reliable, versioned data pipelines.
Pros and Cons
Pros: ACID compliance, time travel, schema enforcement, efficient upserts/deletes.
Cons: Slightly more complex due to Delta Lake features.
Example
CREATE TABLE delta_table (
    id INT,
    name STRING
)
USING DELTA
LOCATION 'abfss://container@storageaccount.dfs.core.windows.net/path/to/delta';

INSERT INTO delta_table VALUES (1, 'Charlie');

SELECT * FROM delta_table;

-- Time travel example
SELECT * FROM delta_table VERSION AS OF 1;
5. Feature Tables
Feature tables are used in machine learning workflows to store and manage feature data for training and inference.
Data Storage and Location
Used for machine learning (ML) feature storage with Databricks Feature Store.
Can be managed or external.
Use Case:
Ideal for managing and sharing features across ML models and teams.
Pros and Cons:
Pros: Centralized feature management, versioning, and lineage tracking.
Pros: Centralized feature management, versioning, and lineage tracking.
Streaming tables are designed for real-time data ingestion and processing using Structured Streaming.
Data Location:
Can be stored in managed or external storage.
Use Case:
Ideal for real-time data pipelines and streaming analytics.
Pros and Cons
Pros: Supports real-time data processing, integrates with Delta Lake for reliability.
Cons: Requires understanding of streaming concepts and infrastructure.
Example:
CREATE TABLE streaming_table (
    id INT,
    name STRING
)
USING DELTA;

from pyspark.sql import SparkSession
spark = SparkSession.builder.appName("StreamingExample").getOrCreate()
streaming_df = spark.readStream.format("delta").load("/path/to/delta")
streaming_df.writeStream.format("delta").outputMode("append").start("/path/to/streaming_table")
Delta Live Tables (DLT)
Delta Live Tables (DLT) is the modern replacement for Live Tables. It is a framework for building reliable, maintainable, and scalable ETL pipelines using Delta Lake. DLT automatically handles dependencies, orchestration, and error recovery.
Data storage and Location:
Data is stored in Delta Lake format, either in managed or external storage.
Use Case:
Building production-grade ETL pipelines for batch and streaming data.
DLT pipelines are defined using Python or SQL.
Tables are automatically materialized and can be queried like any other Delta table.
Pros and Cons
Declarative pipeline definition.
Automatic dependency management.
Built-in data quality checks and error handling.
Supports both batch and streaming workloads.
Cons: Requires understanding of Delta Lake and ETL concepts.
Hive tables are legacy tables that use the Apache Hive format. They are supported for backward compatibility.
Data storage Location:
Can be stored in managed or external storage.
Use Case:
Legacy systems or migration projects.
Pros and Cons
Pros: Backward compatibility with older systems.
Cons: Lacks modern features like ACID transactions and time travel.
Example
CREATE TABLE hive_table (
    id INT,
    name STRING
)
STORED AS PARQUET;

INSERT INTO hive_table VALUES (1, 'Dave');
SELECT * FROM hive_table;
Final Thoughts
Use Delta Live Tables for automated ETL pipelines.
Use Feature Tables for machine learning models.
Use Foreign Tables for querying external databases.
Avoid Hive Tables unless working with legacy systems.
Summary
Managed Tables: Fully managed by Databricks, ideal for internal workflows.
External Tables: Metadata managed by Databricks, data stored externally, ideal for cross-platform sharing.
Delta Tables: Advanced features like ACID transactions and time travel, ideal for reliable pipelines.
Foreign Tables: Query external systems without data duplication.
Streaming Tables: Designed for real-time data processing.
Feature Tables: Specialized for machine learning feature management.
Hive Tables: Legacy format, not recommended for new projects.
Each table type has its own creation syntax and usage patterns, and the choice depends on your specific use case, data storage requirements, and workflow complexity.
Please do not hesitate to contact me if you have any questions at William . chen @ mainri.ca
Alter Row transformation in ADF modifies data rows in a data flow. It handles insert, update, delete, and upsert operations. You define conditions for each operation. Use it to apply changes to a destination dataset. It works with databases supporting CRUD operations. Configure it in the mapping data flow. Map input columns to target columns. Set policies for row changes. It ensures data consistency. Use expressions for conditional logic. It’s useful for incremental data loads. Supports SQL-based sinks. Optimize performance with proper partitioning.
What is the Alter Row Transformation?
The Alter Row Transformation is used to set row-level policies for data being written to a sink. This transformation is particularly useful when you are working with slowly changing dimensions (SCD) or when you need to synchronize data between source and sink systems.
Key Features
Define Row Actions:
Insert: Add new rows.
Update: Modify existing rows.
Delete: Remove rows.
Upsert: Insert or update rows.
No Action: Ignore rows.
Condition-Based Rules:
Define rules using expressions for each action.
Works with Supported Sinks:
SQL Database, Delta Lake, and more.
How Does the Alter Row Transformation Work?
Input Data: The transformation takes input data from a previous transformation in the data flow.
Define Conditions: You define conditions for each action (insert, update, delete, upsert) using expressions.
Output to Sink: The transformation passes the data to the sink, where the specified actions are performed based on the conditions.
Preparing test data
We will focus on aggregate transformation core concepts.
id CustID Product Quantity Amount
1  C1      A	  2	 20
2  C1      B	  3	 30
3  C2      C	  1	 10
4  C1      A	  2	 20
5  C3      A	  3	 30
6  C2      B	  1	 10
7  C3      C	  2	 20
8  C1      C	  3	 30
9  C1      A	  2	 20
10 C2      A	  1	 30
11 C3      C	  3	 10
Use Alter Row Transformation
Step 1: Create Data Flow
Create a Data Flow, add a source transformation and configure it.
preview source data
Step 2: add Alter Transformation
Alter row condition has 4 options:
Insert if
Update if
Delete if
Upsert if
Using Dataflow expression builder to build condition
preview its output.
We must originate the action order. Actions are processed in the order defined
Step 3: Add Sink transformation
Add a Sink Transformation, configure it.
Currently, Sink Transformation support some of datasets, Inline datasets and dataset object. such as Database, Blob, ADLS, Delta Lake (Online dataset), detail list at Microsoft Documentation
Inline datasets are recommended when you use flexible schemas, one-off sink instances, or parameterized sinks. If your sink is heavily parameterized, inline datasets allow you to not create a “dummy” object. Inline datasets are based in Spark, and their properties are native to data flow.
Dataset objects are reusable entities that can be used in other data flows and activities such as Copy.
For this demo, we are using Delta, Inline dataset.
When alter row policy allow Delete, Update, Upsert, we have to set Primary Key.
Use Data Flow in Pipeline
we completed the data flow, it is ready for use it in pipeline.
Create a pipeline
Create a pipeline and configure the data flow.
let’s change the source data
Execute the pipeline again, the delta table result
Conclusion
Notes
Actions are processed in the order defined.
Test rules with Data Preview.
Primary Key: The sink must have keys for updates and deletes. Ensure that your sink has a primary key defined, as it is required for update, delete, and upsert operations.
By using the Alter Row Transformation in ADF, you can efficiently manage data changes and ensure that your sink systems are always up-to-date with the latest data from your sources. This transformation is a powerful tool for data engineers working on ETL/ELT pipelines in Azure.
Please do not hesitate to contact me if you have any questions at William . Chen @ mainri.ca
The Aggregate transformation in Azure Data Factory (ADF) Data Flows is a powerful tool for performing calculations on groups of data. It’s analogous to the GROUP BY clause in SQL, allowing you to summarize data based on one or more grouping columns.
Purpose
The Aggregate transformation allows you to:
Group data: Group rows based on the values in one or more specified columns.
Perform aggregations: Calculate aggregate values (like sum, average, count, min, max, etc.) for each group.
Key Features and Settings:
Group By: This section defines the columns by which the data will be grouped. You can select one or more columns. Rows with the same values in these columns will be grouped together.
Aggregates: This section defines the aggregations to be performed on each group. You specify:
New column name: The name of the resulting aggregated column.
Expression: The aggregation function and the column to which it’s applied.
Available Aggregate Functions
ADF Data Flows support a wide range of aggregate functions, including:
avg(column): Calculates the average of a column.
count(column) or count(*): Counts the number of rows in a group. count(*) counts all rows, even if some columns are null. count(column) counts only non-null values in the specified column.
max(column): Finds the maximum value in a column.
min(column): Finds the minimum value in a column.
sum(column): Calculates the sum of a column.
collect(column): Collects all values within a group into an array.
first(column): Returns the first value encountered in the group.
last(column): Returns the last value encountered in the group.
stddev(column): Calculates the standard deviation of a column.
variance(column): Calculates the variance of a column.
Preparing test data
With assumed ADF/Synapse expertise, we will focus on aggregate transformation core concepts.
sample dataset
CustID Product Quantity Amount
C1,     A,      2,      20
C1,     B,      3,      30
C2,     C,      1,      10
C1,     A,      2,      20
C3,     A,      3,      30
C2,     B,      1,      10
C3,     C,      2,      20
C1,     C,      3,      30
C1,     A,      2,      20
C2,     A,      1,      30
C3,     C,      3,      10
Create Data Flow
Configure Source
Add Aggregate Transformation
he functionality of aggregate transformations is equivalent to that of the GROUP BY clause in T-SQL.
in SQL script, we write this query:
select product
, count(quantity) as sold_times
, sum(quantity) as sold_items
, sum(amount) as sold_amount
, avg(amount) as Avg_price
from sales group by product;

get this result
product	sold_times  sold_items  sold_amount   Avg_price
A	   10		6	 120	      24.0
B	   4		12	 40	      20.0
C	   9		3	 70	      17.5
Using Aggregate transformation in this way.
we can use “expression builder” to write the expression
It performs the same grouping and aggregation operations as TSQL’s GROUP BY.
Important Considerations
Null Handling: Pay attention to how aggregate functions handle null values. For example, sum() ignores nulls, while count(column) only counts non-null values.
Data Types: Ensure that the data types of the columns you’re aggregating are compatible with the chosen aggregate functions.
Performance: For large datasets, consider partitioning your data before the Aggregate transformation to improve performance.
Distinct Count: For calculating distinct counts, use the countDistinct(column) function.
Conclusion
By using the Aggregate transformation effectively, you can efficiently summarize and analyze your data within ADF Data Flows. Remember to carefully consider the appropriate aggregate functions and grouping columns to achieve your desired results.
Please do not hesitate to contact me if you have any questions at William . chen @ mainri.ca
Creating a robust data migration checklist can be challenging, particularly for those new to the process. To simplify this, we’ve compiled a core set of essential activities for effective data migration planning. This checklist, designed to support thorough preparation for data migration projects, has been successfully used across diverse migration projects over several years, including those for financial institutions (including banks), insurance companies, consulting firms, and other industries. While not exhaustive, it provides a solid foundation that can be customized with project-specific requirements.
In relational databases, locks are essential mechanisms for managing concurrent access to data. They prevent data corruption and ensure data consistency when multiple transactions try to read or modify the same data simultaneously.
Without locks, concurrent transactions could lead to several problems. For example,
Dirty Reads, a transaction may read data that has been modified by another transaction but not yet committed;
Lost updates, one transaction’s updates may be overwritten by another transaction;
Non-Repeatable Reads, A transaction reads the same data multiple times, and due to updates by other transactions, the results of each read may be different;
Phantom Reads: A transaction executes the same query multiple times, and due to insertions or deletions by other transactions, the result set of each query may be different.
Here’s a detailed breakdown of locks in relational databases.
Types of Locks
Relational databases use various types of locks with different levels of restriction:
Shared Lock
Allows multiple read operations simultaneously. Prevents write operations until the lock is released.
Example: SELECTstatements in many databases.
Exclusive Lock
Allows a single transaction to modify data. Prevents other operations (read or write) until the lock is released.
Example: UPDATE, DELETE.
Update Lock
Prevents deadlocks when a transaction might upgrade a shared lock to an exclusive lock.
Intent Lock
Indicate the type of lock a transaction intends to acquire. Intent Shared (IS): Intends to acquire a shared lock on a lower granularity level. Intent Exclusive (IX): Intends to acquire an exclusive lock on a lower granularity level.
Lock Granularity
Locks can be applied at different levels of granularity.
Row-Level Lock
Locks a specific row in a table. Provide the highest concurrency, but if many rows are locked, it may lead to lock management overhead. Example: Updating a specific record (UPDATE ... WHERE id = 1).
Page-Level Lock
Locks a data page, a block of rows. Provide a compromise between concurrency and overhead.
(a page is a fixed-size storage unit)
Table-Level Lock
Locks an entire table. Provide the lowest concurrency but minimal overhead.
Example: Prevents any modifications to the table during an operation like ALTER TABLE.
Lock Duration
Transaction Locks: Held until the transaction is committed or rolled back.
Session Locks: Held for the duration of a session.
Temporary Locks: Released immediately after the operation completes.
Deadlocks Prevention and Handling
A deadlock occurs when two or more transactions are waiting for each other to release locks. Databases employ deadlock detection and resolution mechanisms to handle such situations.
Prevent Deadlocks
Avoid Mutual Exclusion Use resources that allow shared access (e.g., shared locks for read-only operations).
Eliminate Hold and Wait Require transactions to request all resources they need at the beginning. If any resource is unavailable, the transaction must wait without holding any resources.
Allow Preemption If a transaction requests a resource that is held by another, the system can preempt (forcefully release) the resource from the holding transaction. The preempted transaction is rolled back and restarted.
Break Circular Wait Impose a global ordering on resources and require transactions to request resources in that order. For example, if resources are ordered as R1, R2, R3, a transaction must request R1 before R2, and R2 before R3.
Handle Deadlocks
If deadlocks cannot be prevented, the database system must detect and resolve them. Here’s how deadlocks are typically handled:
Deadlock Detection The database system periodically checks for deadlocks by analyzing the wait-for graph, which represents transactions and their dependencies on resources. If a cycle is detected in the graph, a deadlock exists.
Deadlock Resolution Once a deadlock is detected, the system must resolve it by choosing a victim transaction to abort. The victim is typically selected based on criteria such as:
Transaction Age: Abort the newest or oldest transaction.
Transaction Progress: Abort the transaction that has done the least work.
Priority: Abort the transaction with the lowest priority.
The aborted transaction is rolled back, releasing its locks and allowing other transactions to proceed.
Conclusion
Locks are crucial for ensuring data consistency and integrity in relational databases. Understanding the different types of locks, lock granularity, locking protocols, and isolation levels is essential for database developers and administrators to design and manage concurrent applications effectively.
Please do not hesitate to contact me if you have any questions at William . chen @ mainri.ca
In general, data migration is the process of moving digital information. These projects are often initiated due to various reasons, such as upgrading databases, deploying new applications, or migrating from on-premises to cloud-based environments. The migration process typically involves preparing, extracting, transforming, and loading the data, usually as a one-time effort.
Data Migration Types
Migration types refer to the various strategies used to move databases, storage, applications, business processes, and cloud environments. Common migration types are described below. The specific type of data migration undertaken depends on business requirements.
Database migration
Database migration can refer to either moving data from one database vendor to another, or to upgrading your database software to a newer version. The data format can vary between vendors so a transformation process may be required. In most cases, a change in database technology should not affect the application layer but you should definitely test to confirm.
Storage migration
Storage migration involves transferring data from an existing repository to another, often new repository. The data usually remains unchanged during a storage migration. The goal is typically to upgrade to more modern technology which scales data more cost-effectively and processes data faster.
Business process migration
Business process migration involves the transfer of databases and applications containing data related to customers, products, and operations. Data often requires transformation as it moves from one data model to another. These projects are usually triggered by a company reorganization, merger or acquisition.
Application migration
Application migration refers to moving a software application such as an ERP or CRM system from one computing environment to another. The data usually requires transformation as it moves from one data model to another. This process most often occurs when the company decides to change to a new application vendor and/or involves transferring from on-premises to a public cloud or moving from one cloud to another.
Cloud migration
Cloud migration is a frequently discussed aspect of data migration, encompassing the movement of data, applications, and other business components to a cloud computing environment, including cloud data warehouses. This migration can occur from an on-premises data center to a public cloud, or between different cloud platforms. The reverse process, known as “cloud exit,” involves migrating data and applications from the public cloud back to an on-premises infrastructure.
Common Data Migration Challenges
Due to the criticality of data to organizational operations, data migration is a complex process necessitating thorough risk assessment. Numerous challenges frequently arise during implementation. The following are some of the most common data migration challenges.
Data Loss: Data Loss: Incomplete data transmission can occur. This can result in irrevocable data loss.
Semantics errors: Data migration can lead to semantic errors, where the meaning or interpretation of data changes. For instance, if a source field called “grand total” is migrated to a different field or column in the target system, the data’s intended meaning is lost or distorted.
Extended downtime: If the migration process takes longer than anticipated, it can lead to significant disruptions and losses for your business.
Data corruption: Migrating unwanted data types can corrupt the target system. This can lead to system crashes or damage the data organization.
Performance: Performance issues can stem from poor code quality, application bugs, or an inability to handle high workloads.
Orchestration: Orchestration refers to the organized migration of disparate data from multiple sources to a unified location. Inadequate data migration planning can lead to the unintended creation of new data silos by failing to maintain proper tracking of data points. This issue is compounded when multiple disconnected teams operate within different departments or when functional and technical teams utilize data in a variety of ways.
Integration: Integrating data sources with other tools and systems allows for data sharing. However, improper integration can lead to the loss of valuable insights.
User training: Data migration necessitates a shift in staff focus from existing systems to a new platform. Without adequate training on the new system, users are more prone to making errors.
Data security: Data migration introduces significant security risks, including potential exposure to third parties and the possibility of migrating to a more vulnerable system.
Data quality: Poor data quality, including missing, inconsistent, useless, or incorrect data, can have significant negative consequences when migrated. These consequences include reduced target system performance, bugs, and system errors.
Not only above mentioned challenges, but business continuity and costs are common faced challenges.
Business continuity: To ensure a positive user experience during data migration, minimize service disruption. When downtime or slowdowns are unavoidable, schedule migrations during off-peak hours and provide clear, timely communication to users through multiple channels, including email, in-app notifications, and social media.
Costs: Data migration involves various expenses, including tools, human resources, new infrastructure, and decommissioning costs for old infrastructure. Thorough budgeting is essential before starting the process. Factor in potential productivity and revenue losses due to downtime. Minimizing outages and proactive user communication can help control migration costs.
Common migration strategy
Several common strategies are employed for data migration, which is the process of moving data between platforms. These include:
Big Bang data migration
In a Big Bang migration, all data assets are moved from the source environment to the target environment in a single, comprehensive operation within a relatively short window of time. This approach necessitates system downtime during the data transfer and transformation process to ensure compatibility with the target infrastructure.
Advantages: less costly, less complex, takes less time, all changes happen once
Disadvantages: a high risk of expensive failure, requires downtime
The big bang approach fits small companies or businesses working with small amounts of data. It doesn’t work for mission-critical applications that must be available 24/7.
Trickle migration
Trickle Migration (also known as phased or iterative migration): This strategy divides the overall migration process into smaller, manageable sub-migrations, each with its own specific objectives, timelines, scope, and quality assurance measures. By operating the old and new systems concurrently and migrating data in small increments, trickle migration achieves near-zero downtime, maintaining uninterrupted application availability for users.
Advantages: less prone to unexpected failures, zero downtime required
Disadvantages: more expensive, takes more time, needs extra efforts and resources to keep two systems running
Trickle migration is the right choice for medium and large enterprises that can’t afford long downtime but have enough expertise to face technological challenges.
Comparison of Migration strategy
Feature/Aspect
Trickle Migration
Big Bang Migration
Definition
Data and systems are migrated incrementally, in smaller phases, over time.
All data and systems are migrated in one large, single event.
Approach
Iterative and gradual.
One-time, all-at-once migration.
Timeline
Extended, as it spans multiple phases or iterations.
Shorter, focused on a single migration window.
Risk
Lower risk due to phased testing and gradual changes.
Higher risk because everything changes at once.
Complexity
More complex due to managing coexistence of old and new systems.
Simpler as there’s no coexistence of systems.
Downtime
Minimal downtime per phase, but over a longer time overall.
Typically involves a significant downtime window.
Testing
Easier to test in smaller chunks.
Requires comprehensive pre-migration testing.
User Impact
Lower immediate impact, users can transition gradually.
High immediate impact, users must adapt quickly.
Cost
Potentially higher due to prolonged migration and dual operations.
Lower due to single-event focus but risks unforeseen costs from errors.
Suitability
Best for large, complex systems with critical operations needing minimal disruptions.
Best for smaller, less complex systems or when speed is a priority.
Migration Process
Data migration projects, due to their involvement with critical data and potential impact on stakeholders, present inherent challenges. Prior to any data transfer, a robust and well-defined migration plan is a necessity. A successful data migration initiative is predicated on an initial, comprehensive analysis and assessment of the data’s lifecycle. Irrespective of the specific methodology employed, all data migration projects adhere to a consistent set of key phases.
Stage 1: Project Planning
Prior to commencing the migration process, it is imperative to establish well-defined objectives and delineate the scope of the data migration. This process involves determining the precise data set required for transfer, including the identification and exclusion of obsolete records. Furthermore, potential compatibility issues between the source and target environments must be addressed, particularly in cases involving migration between disparate database paradigms, such as from a relational database (e.g., Oracle) to a non-relational database (e.g., MongoDB).
This initial phase involves follow key steps:
1.1. Define clear and measurable objectives
Define clear and measurable objectives for the data migration project, including specifying the precise data to be migrated, defining success criteria.
1.2. Refine the project scope
Define the precise scope of the data migration by identifying and excluding all non-essential data elements, focusing solely on the minimum dataset necessary to ensure effective target system operation. This process necessitates a high-level comparative analysis of the source and target systems, conducted in consultation with the end-users directly impacted by the migration.
1.3. Risk assessment
A comprehensive risk assessment is conducted to identify potential challenges and roadblocks that could impede the data migration project. This assessment includes evaluating potential impacts on the organization and developing mitigation strategies for contingencies such as data loss, downtime, or other failures.
1.4. Estimate the budget and set realistic timelines
Subsequent to scope refinement and system evaluation, the appropriate migration methodology (e.g., Big Bang or Trickle) is selected, resource requirements are estimated, and a realistic project timeline is defined. It should be noted that enterprise-scale data migration projects typically require a duration of six months to two years.
Stage 2: Discovery and Profiling
This initial phase of the data migration methodology involves a comprehensive assessment of the data landscape. This assessment encompasses data inventory, analysis, auditing, and profiling to thoroughly examine and cleanse the data set targeted for migration. The objective is to identify and address potential data conflicts, detect and remediate data quality issues, and eliminate redundant or anomalous data elements prior to the commencement of the migration process.
2.1. Source System Assessment
2.1.1. Identify Data Sources
Primary Sources: Identify the primary sources of data, such as databases, files, APIs, etc.
Secondary Sources: Identify any secondary or external data sources that may need to be migrated.
2.1.2. Understand the Data Structure
Data Models: Review the data models, schemas, and relationships between different data entities.
Data Types: Identify the types of data (e.g., text, numeric, date, binary) and their formats.
Data Volume: Estimate the volume of data to be migrated, including the number of records, tables, and databases.
Data Quality: Assess the quality of the data, including issues like duplicates, missing values, and inconsistencies.
2.1.3. Analyze Data Dependencies
Interdependencies: Identify relationships and dependencies between different data entities.
Business Rules: Understand any business rules or logic applied to the data in the source system.
Data Flow: Map out how data flows through the source system, including ETL (Extract, Transform, Load) processes.
2.1.4. Evaluate Data Security and Compliance
Access Controls: Review who has access to the data and what permissions they have.
Encryption: Check if data is encrypted at rest or in transit.
Compliance: Ensure the data complies with relevant regulations (e.g., GDPR, HIPAA).
2.1.5. Document Source System
Metadata: Document metadata, including data definitions, formats, and constraints.
Data Dictionary: Create or update a data dictionary that describes the data elements in the source system.
2.2. Target System Assessment
2.2.1. Understand the Target System Architecture
Data Models: Review the data models and schemas of the target system.
Data Types: Ensure the target system supports the data types and formats used in the source system.
Storage Capacity: Verify that the target system has sufficient storage capacity for the migrated data.
2.2.2. Evaluate Data Transformation Requirements
Data Mapping: Map data fields from the source system to the target system.
Data Transformation: Identify any transformations needed to convert data from the source format to the target format.
Data Validation: Plan for data validation to ensure accuracy and completeness after migration.
2.2.3. Assess System Performance
Performance Benchmarks: Evaluate the performance of the target system to ensure it can handle the volume and complexity of the migrated data.
Scalability: Ensure the target system can scale to accommodate future data growth.
2.2.4. Review Security and Compliance
Access Controls: Ensure the target system has appropriate access controls in place.
Encryption: Verify that data will be encrypted at rest and in transit in the target system.
Compliance: Ensure the target system complies with relevant regulations.
2.2.5. Test the Target System
Test Environment: Set up a test environment that mirrors the target system.
Pilot Migration: Perform a pilot migration to test the process and identify any issues.
User Acceptance Testing (UAT): Conduct UAT to ensure the migrated data meets user requirements.
2.3. Comparative Analysis of Source and Target Systems
2.3.1. Network and Connectivity
Confirm bandwidth, latency, and reliability between source and target systems.
Address firewall or VPN requirements for data flow.
2.3.2. Data Transformation Needs
Determine if data needs cleansing, enrichment, or reformatting during migration. Plan for ETL (Extract, Transform, Load) processes if required.
2.3.3. Testing Environments
Establish sandbox or test environments in both systems for validation.
2.3.4. Documentation and Communication
Document findings and share with stakeholders to align expectations. Maintain clear communication between teams managing source and target systems.
Stage 3: Resource Allocation and Solution Development
For large data assets, a phased development approach is recommended, wherein the data is segmented, and the migration logic is developed and tested iteratively for each segment.
3.1 Set data standards
This will allow your team to spot problem areas across each phase of the migration process and avoid unexpected issues at the post-migration stage.
3.2 Architecture Design and Resource Allocation
This phase encompasses both the design of the migration architecture and the allocation of necessary resources. It is imperative to confirm the availability and commitment of all requisite resources, including internal personnel, external consultants, vendors, and enabling technologies. This verification extends to resources required for post-migration activities, such as user training and communication. Upon confirmation of resource availability, the development of the migration logic commences, encompassing the processes of data extraction, transformation, and loading (ETL) into the designated target repository.
3.3 Create a Detailed Migration Plan
Data Extraction: Plan for data extraction from the source system.
Data Transformation: Outline the steps for data transformation.
Data Loading: Plan for loading data into the target system.
Testing: Include testing phases in the migration plan.
stage 4: Backup and Contingency Planning
Despite careful planning, data migration projects can face unexpected challenges. A robust backup strategy is essential to ensure data can be recovered and systems remain operational in the event of unforeseen issues during the migration process. Furthermore, detailed contingency plans should be developed to address each identified potential setback or roadblock.
stage 5: Execution
5.1. Pre-migration – sampling testing
To assess the accuracy of the migration and identify any potential data quality issues, test the migration process using a representative data sample.
5.2. User Acceptance Testing (UAT)
User Acceptance Testing (UAT) is a critical phase in the data migration process where end-users validate that the migrated data and system meet their business requirements and expectations. UAT ensures that the migration solution works as intended in a real-world scenario before it is fully deployed. we should focus on business goals and customer satisfaction.
5.3. Executing the Migration Solution
Following successful completion of testing procedures, the data migration process, encompassing data extraction, transformation, and loading (ETL), is formally initiated. In a Big Bang migration scenario, the execution phase is typically completed within a period of several days. Conversely, the Trickle migration methodology employs an incremental data transfer approach, resulting in a more protracted execution timeline but significantly mitigating the risk of critical system failures and minimizing downtime.
stage 6: Documentation and Reporting
After completing a data migration, documentation and reporting are critical steps to ensure the process is well-documented, auditable, and provides insights for future improvements. Proper documentation and reporting help stakeholders understand the migration’s success, identify any issues, and maintain a record for compliance and reference purposes.
6.1. Documentation
Documentation provides a detailed record of the data migration process, including the steps taken, decisions made, and outcomes. It serves as a reference for future migrations, audits, or troubleshooting.
Key Components of Documentation
Migration Plan:
Include the original migration plan, including objectives, scope, timelines, and resource allocation.
Data Mapping:
Document the mapping of source data fields to target data fields.
Include any transformations or conversions applied during the migration.
Data Validation:
Record the validation rules and checks performed to ensure data accuracy and completeness.
Include sample validation results and any discrepancies found.
Error Handling:
Document any errors encountered during the migration and how they were resolved.
Include a log of rejected or failed records and the reasons for rejection.
Migration Tools and Scripts:
Provide details of the tools, scripts, or software used for the migration.
Include version numbers, configurations, and any custom code.
Testing Results:
Document the results of pre-migration testing, including unit tests, integration tests, and user acceptance tests (UAT).
Include test cases, expected outcomes, and actual results.
Post-Migration Verification:
Record the steps taken to verify the success of the migration.
Include checks for data integrity, completeness, and performance in the target system.
Lessons Learned:
Summarize what went well and what could be improved in future migrations.
Include feedback from the migration team and stakeholders.
Compliance and Security:
Document compliance with relevant regulations (e.g., GDPR, HIPAA).
Include details of security measures taken during the migration.
Rollback Plan:
Document the rollback plan and whether it was executed (if applicable).
Include details of any fallback procedures used.
6.2. Reporting
Reporting provides a summary of the migration process and outcomes for stakeholders. It highlights key metrics, successes, and areas for improvement.
Key Components of Reporting
Executive Summary:
Provide a high-level overview of the migration, including objectives, scope, and outcomes.
Highlight key achievements and challenges.
Migration Metrics:
Include quantitative metrics such as:
Volume of data migrated (e.g., number of records, tables, databases).
Time taken for the migration.
Number of errors or rejected records.
Downtime (if applicable).
Data Quality Report:
Summarize the results of data validation and quality checks.
Include metrics such as:
Percentage of accurate records.
Percentage of incomplete or duplicate records.
Number of records requiring manual intervention.
Performance Report:
Compare the performance of the target system before and after migration.
Include metrics such as:
Response times.
Throughput.
System uptime.
Issue and Risk Log:
Provide a summary of issues encountered during the migration and how they were resolved.
Include a risk assessment and mitigation strategies.
Stakeholder Feedback:
Summarize feedback from stakeholders, including end-users, IT teams, and business leaders.
Highlight any concerns or suggestions for improvement.
Post-Migration Support:
Document the support provided after the migration, including:
Troubleshooting and issue resolution.
User training and documentation.
Monitoring and maintenance activities.
Recommendations:
Provide recommendations for future migrations or system enhancements.
Include best practices and lessons learned.
stage 7: Post-Migration Assessment Validating, Auditing and Monitor
7.1. Post-migration Validation and Auditing.
Once the migration is complete, perform post-migration validation to verify that all data is accurately transferred and that the new system functions as expected. Conduct regular audits to ensure data integrity and compliance with data regulations.
7.2. User Training and Communications
User Training and Communications, Ongoing stakeholder communications is crucial throughout the data migration process. This should include keeping everyone informed about the migration schedule, potential disruptions, and expected outcomes, as well as providing end-user training/instructions to smooth the transition and prevent any post-migration usability issues. Once the migration is complete, perform post-migration validation to verify that all data is accurately transferred and that the new system functions as expected. Conduct regular audits to ensure data integrity and compliance with data regulations.
7.3. Continuous Performance Monitoring
Ongoing monitoring of the new system’s performance is vital for surfacing any post-migration data loss and/or data corruption issues. Regularly assess the target system’s performance and investigate any potential data-related performance bottlenecks/issues.
7.4. Data Security and Compliance
Last but certainly not least, ensure that data security and compliance requirements are met during and after the migration process. This may include implementing data encryption at rest and in transit, access controls, and data protection measures to safeguard sensitive information.
Conclusion
Assessing the source and target systems is a foundational step in ensuring a successful data migration. By thoroughly evaluating both systems, identifying potential risks, and developing a comprehensive migration plan, you can minimize disruptions and ensure that the migrated data is accurate, secure, and compliant with relevant regulations.
Sticking to the best practices can increase the likelihood of successful data migration. each data migration project is unique and presents its own challenges, the following golden rules may help companies safely transit their valuable data assets, avoiding critical delays.
Use data migration as an opportunity to reveal and fix data quality issues. Set high standards to improve data and metadata as you migrate them.
Hire data migration specialists and assign a dedicated team to run the project.
Minimize the amount of data for migration.
Profile all source data before writing mapping scripts.
Allocate considerable time to the design phase as it greatly impacts project success.
Don’t be in a hurry to switch off the old platform. Sometimes, the first attempt at data migration fails, demanding rollback and another try.
Data migration is often viewed as a necessary evil rather than a value-adding process. This seems to be the key root of many difficulties. Considering migration an important innovation project worthy of special focus is half the battle won.
Please do not hesitate to contact me if you have any questions at William . chen @ mainri.ca